A Practical Guide to Profiling in Go
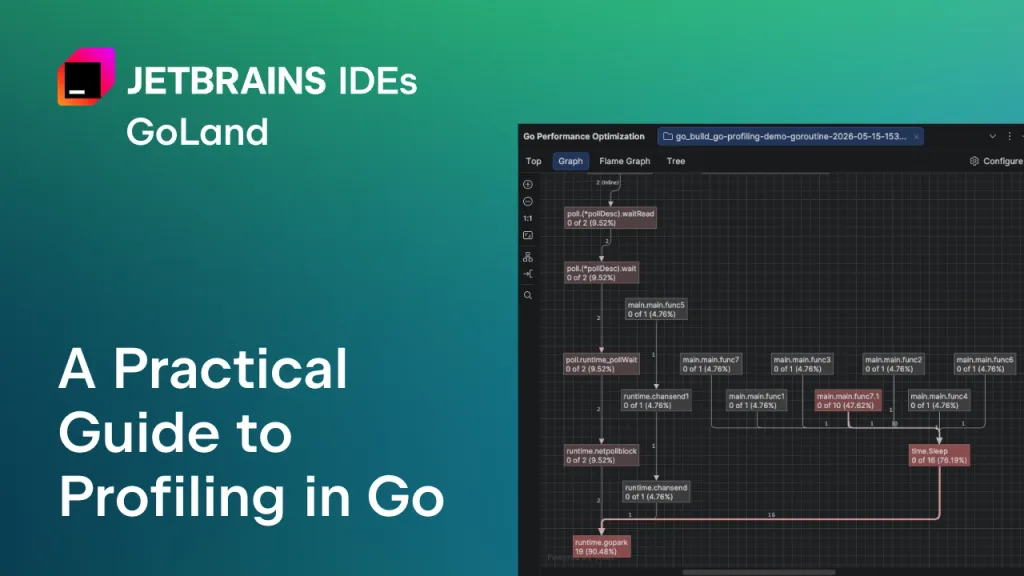
The article provides a practical guide to profiling in Go using the built-in pprof tool. It discusses the challenges developers face with profiling, including interpreting low-level data and the complexity of the tool. The guide aims to simplify the profiling process and explains various profiling types available in Go.
- ▪Go's standard library includes a profiling tool called pprof that samples the call stack.
- ▪Profiling helps identify CPU bottlenecks, memory issues, and concurrency problems.
- ▪The article explains different profiling types in Go, including CPU, memory, and goroutine profiling.
2 outlets in our directory ran this story, first to last over 6 hours. All of the coverage we found sits in one bucket: centre. That one-sidedness is itself worth noticing.
- ▪ Team Topologies for DevOps: A Practical Implementation Guide — DEV.to (Top)
Hacker News (Newest) files mainly under programming. We currently carry 5,306 of its stories.
Story provenance
Source · retrieval · rights · ranking — open for full record
inspect →
Story provenance
Attribution is not the same as permission. This drawer separates discovery metadata, excerpts, WeSearch-generated summaries, reuse status, and whether the publisher receives the visit. Nothing here claims a legal grant the publisher has not made.
Record
| Original publisher | The JetBrains Blog |
| Canonical URL | https://blog.jetbrains.com/go/2026/05/20/golang-profiling-guide/ |
| Publication time | Thu, 21 May 2026 05:33:43 +0000 |
| Retrieval time | 2026-05-21T06:05:03.544Z |
| Last seen | 2026-05-21T06:05:03.544Z |
| Headline source | Publisher (no WeSearch rewrite) |
| Excerpt source | publisher body |
| Excerpt method | First ~120 words (~800 chars) of extracted publisher body, fair-use limited. |
| Summary | WeSearch · cerebras-chat (WeSearch summarizer) |
| Summary source text | contentText |
| Citation coverage | Summary is a WeSearch-generated derivative; primary citation is the original publisher URL. |
| Cluster | P7TiJ30B4nZY · 3 stories |
| Cluster logic | Grouped by semantic title/content similarity across sources within a rolling window. Same-publisher template collisions are excluded from coverage comparison. |
| Ranking reason | Story pages are not engagement-ranked. Hub feeds use recency, with optional source-diversified chronological ordering (cap consecutive stories per source). No personalized ranking. |
| Publisher visit | Yes — open original |
| Substitutes article? | No — link-out required for full text |
Rights status (four layers)
WeSearch handling by dimension
| Indexing | May the item be indexed (stored, ranked, made findable)? | Allowed |
| Snippet | May a short excerpt of the publisher's text be shown? | Allowed |
| AI summary | May WeSearch generate its own short summary of the article? | Limited |
| Retrieval / RAG | May the content be exposed for third-party retrieval-augmented generation? | Not asserted |
| Model training | May the content be used to train AI models? | Not asserted |
| Commercial reuse | May the content be reused commercially? | Not permitted |
Basis: Derived from the published RSS/Atom feed. Contact: [email protected]. Reviewed: 2026-07-24.
Opening excerpt (first ~120 words) tap to expand
GoLand The IDE for professional development in Go Follow Follow: X X Youtube Youtube RSS RSS slack slack Download All News Releases Features Livestreams Early Access Program Tutorials GoLand A Practical Guide to Profiling in Go Dominika Stankiewicz As is often the case with Go, the standard library comes with a great tool for profiling your programs – pprof. It samples your call stack, allowing you to later generate reports that help you analyze and visualize your software’s performance without installing any plugins. Everything you need is in the Go development kit. The problem? It’s a bit of a hassle. In our discussions with Go developers, we’ve heard that some actually avoid it if they can. There could be a few reasons for this.
…
Excerpt limited to ~120 words for fair-use compliance. The full article is at The JetBrains Blog.
Discussion
0 commentsMore from The JetBrains Blog