
Defense against dishonest charts
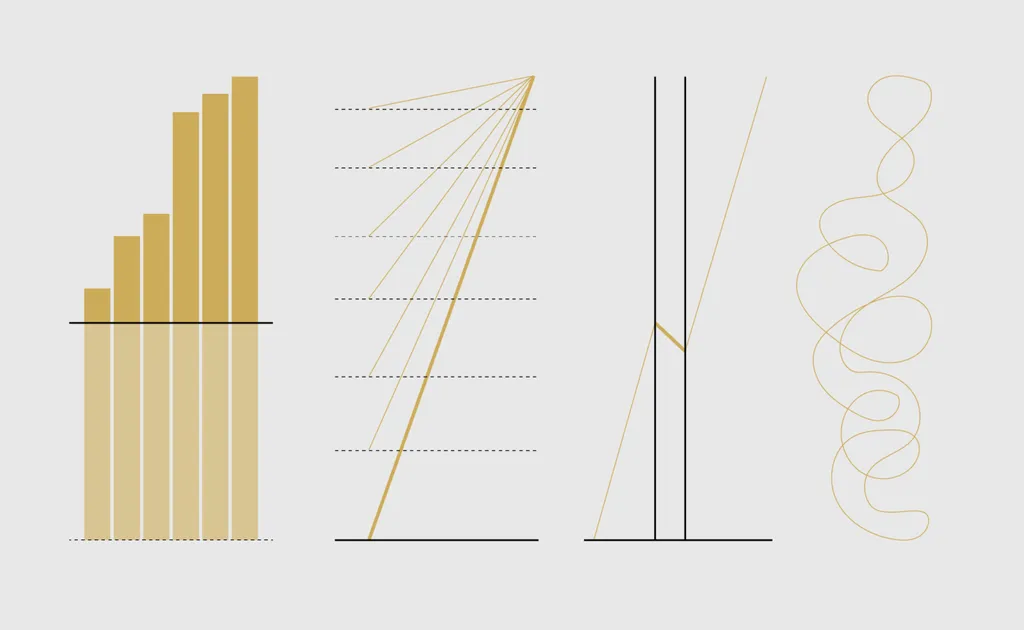
Data visualizations can be misleading because charts are not objective facts but interpretations shaped by choices in design and context. Readers must stay skeptical, examine scales and sources, and understand the intent behind the data presentation. To combat dishonest charts, one should scrutinize the details, question the narrative, and actively correct misinformation.
- ▪A single dataset can support multiple narratives depending on visual encoding and scale.
- ▪Dishonest chartmakers exploit assumptions that readers will not examine context or details.
- ▪Colorful visuals and bold titles can mislead if not interpreted alongside scales, units, and background information.
- ▪Surprising data findings should prompt skepticism and further investigation into the 'who, what, when, where, why, and how' behind the chart.
- ▪Leaving misleading charts uncorrected allows them to spread, much like weeds overtaking a garden.
Sidebar.io files mainly under design. We currently carry 33 of its stories.
Story provenance
Source · retrieval · rights · ranking — open for full record
inspect →
Story provenance
Attribution is not the same as permission. This drawer separates discovery metadata, excerpts, WeSearch-generated summaries, reuse status, and whether the publisher receives the visit. Nothing here claims a legal grant the publisher has not made.
Record
| Original publisher | FlowingData |
| Canonical URL | https://flowingdata.com/projects/dishonest-charts/ |
| Publication time | Mon, 18 May 2026 04:04:00 GMT |
| Retrieval time | 2026-05-17T10:22:13.044Z |
| Last seen | 2026-05-17T10:22:13.044Z |
| Headline source | Publisher (no WeSearch rewrite) |
| Excerpt source | publisher body |
| Excerpt method | First ~120 words (~800 chars) of extracted publisher body, fair-use limited. |
| Summary | WeSearch · cerebras-chat (WeSearch summarizer) |
| Summary source text | contentText |
| Citation coverage | Summary is a WeSearch-generated derivative; primary citation is the original publisher URL. |
| Cluster | 6W1Z7uEbeBEC |
| Cluster logic | Grouped by semantic title/content similarity across sources within a rolling window. Same-publisher template collisions are excluded from coverage comparison. |
| Ranking reason | Story pages are not engagement-ranked. Hub feeds use recency, with optional source-diversified chronological ordering (cap consecutive stories per source). No personalized ranking. |
| Publisher visit | Yes — open original |
| Substitutes article? | No — link-out required for full text |
Rights status (four layers)
WeSearch handling by dimension
| Indexing | May the item be indexed (stored, ranked, made findable)? | Allowed |
| Snippet | May a short excerpt of the publisher's text be shown? | Allowed |
| AI summary | May WeSearch generate its own short summary of the article? | Limited |
| Retrieval / RAG | May the content be exposed for third-party retrieval-augmented generation? | Not asserted |
| Model training | May the content be used to train AI models? | Not asserted |
| Commercial reuse | May the content be reused commercially? | Not permitted |
Basis: Derived from the published RSS/Atom feed. Contact: [email protected]. Reviewed: 2026-07-24.
Opening excerpt (first ~120 words) tap to expand
Reading Data Visualization lets you see data quicker than if you were browsing a spreadsheet, and for many, a better chart means it takes less time to read. Dishonest chartmakers use this assumption to their advantage. They publish any message they want and know that only a fraction of readers think long enough to learn the context of a data point. Sometimes readers catch on, but the dishonest find new tricks. So while it is useful to know misleading varieties, it is better to establish a general approach for reading data. Recognize the possibilities. As we’ve seen in previous examples, a single dataset can represent infinite narratives, depending on the angle you look from. A choice of visual encoding and a shift in scale can make something good look bad.
…
Excerpt limited to ~120 words for fair-use compliance. The full article is at FlowingData.
Discussion
0 commentsMore from FlowingData