Fifty Hours to Draw Some Lines
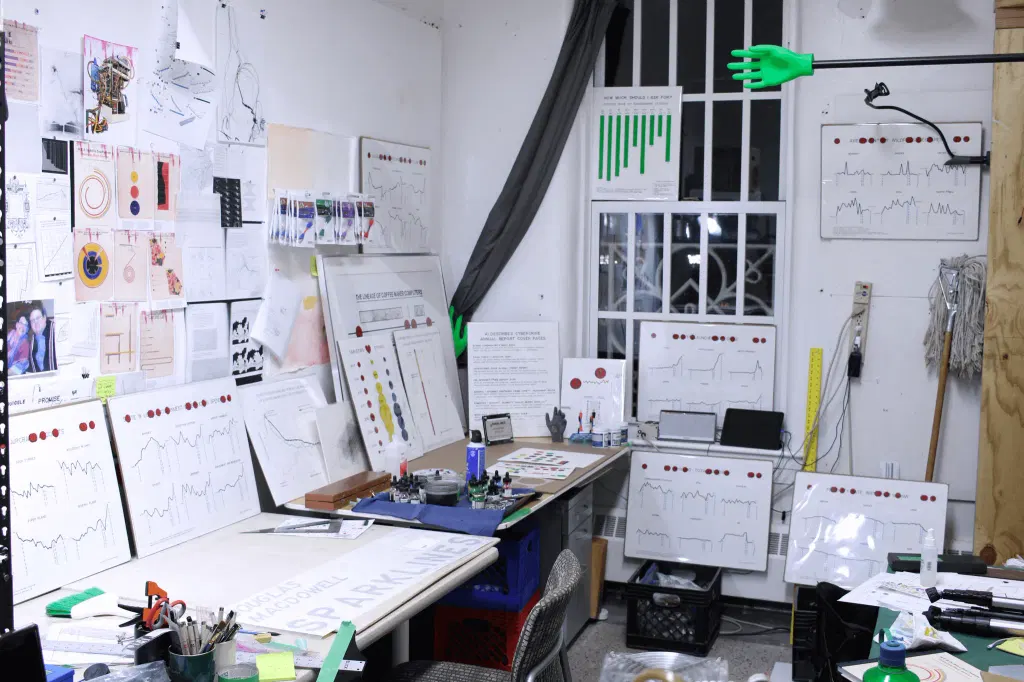
The article discusses the process of hand-drawing data visualizations, highlighting the author's experience of spending 50 hours on a project that could be completed in a fraction of the time using software. It emphasizes the artistic aspect of creating data visualizations by hand, using traditional tools and techniques. The author shares favorite resources and methods for those interested in this craft.
- ▪The author spent 50 hours creating a hand-drawn data visualization of a coffee maker computer.
- ▪The article emphasizes the artistic value of hand-drawing data visualizations compared to using software.
- ▪The author lists several favorite books on hand-drawn data visualization, many of which are available online for free.
Hacker News (Newest) files mainly under programming. We currently carry 5,306 of its stories.
Story provenance
Source · retrieval · rights · ranking — open for full record
inspect →
Story provenance
Attribution is not the same as permission. This drawer separates discovery metadata, excerpts, WeSearch-generated summaries, reuse status, and whether the publisher receives the visit. Nothing here claims a legal grant the publisher has not made.
Record
| Original publisher | Dougmacdowell |
| Canonical URL | https://www.dougmacdowell.com/50-hours-to-draw-some-lines.html |
| Publication time | Wed, 20 May 2026 16:26:18 +0000 |
| Retrieval time | 2026-05-20T16:35:02.753Z |
| Last seen | 2026-05-20T16:35:02.753Z |
| Headline source | Publisher (no WeSearch rewrite) |
| Excerpt source | publisher body |
| Excerpt method | First ~120 words (~800 chars) of extracted publisher body, fair-use limited. |
| Summary | WeSearch · cerebras-chat (WeSearch summarizer) |
| Summary source text | contentText |
| Citation coverage | Summary is a WeSearch-generated derivative; primary citation is the original publisher URL. |
| Cluster | i97KA93ZUcvX |
| Cluster logic | Grouped by semantic title/content similarity across sources within a rolling window. Same-publisher template collisions are excluded from coverage comparison. |
| Ranking reason | Story pages are not engagement-ranked. Hub feeds use recency, with optional source-diversified chronological ordering (cap consecutive stories per source). No personalized ranking. |
| Publisher visit | Yes — open original |
| Substitutes article? | No — link-out required for full text |
Rights status (four layers)
WeSearch handling by dimension
| Indexing | May the item be indexed (stored, ranked, made findable)? | Allowed |
| Snippet | May a short excerpt of the publisher's text be shown? | Allowed |
| AI summary | May WeSearch generate its own short summary of the article? | Limited |
| Retrieval / RAG | May the content be exposed for third-party retrieval-augmented generation? | Not asserted |
| Model training | May the content be used to train AI models? | Not asserted |
| Commercial reuse | May the content be reused commercially? | Not permitted |
Basis: Derived from the published RSS/Atom feed. Contact: [email protected]. Reviewed: 2026-07-24.
Opening excerpt (first ~120 words) tap to expand
50 Hours to Draw Some Lines Hand drawing data visualizations with artist Doug MacDowell Description: I used to live on a quiet road on top of a huge hill. When leaves were on the trees it felt so secluded, and when the leaves fell, the entire city would appear below as sparkling lights. Sometimes, I'd run into a neighbor. "What are you working on these days?" "Data visualizations." I told him. "Ah, you using algorithms, machine learning, cloud computing, things like that?" "No." I said. "I'm just trying to draw a line graph." My neighbor thought I was getting into some complex sh**. But what's been more interesting to me lately than using powerbi, powerpoint, tableau, D3, python, illustrator, R is learning to draw data by hand.
…
Excerpt limited to ~120 words for fair-use compliance. The full article is at Dougmacdowell.
Discussion
0 commentsMore from Dougmacdowell